Report views within Projectricity provide remarkable customization and flexibility in creating custom views of project information. Let every user take full control of how they see the project information that is important to them.
For example, users can design reports that show change requests and defects, tasks or requirements grouped by target releases that affect them. Maybe showing only overdue items sorted by how many days overdue grouped by status with counts is important. Reporting flexibility like this can be a game-changer for many organizations.
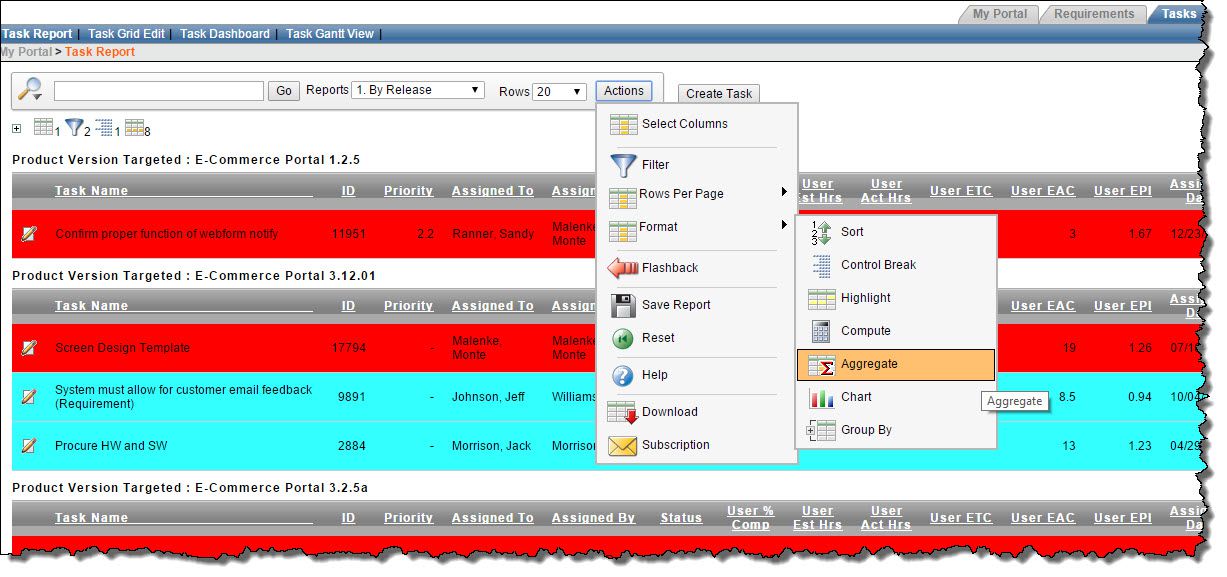
Custom reporting in Projectricity supports the following and more:
- Each user can create and save many custom report views
- Select columns to hide or show
- Re-order columns
- Create derived or calculated data fields
Choose from mathematical and logical functions
Create complex formulas using other columns in the report view
- Column sorting
- Column filtering
- Conditional formatting
Background color of data records
Font colors
- Specify aggregations of data
Shown as groups of data by aggregation breaks
Sub-totals, counts, averages
- Visual representations of report data in chart views
- Extract report data into a spreadsheet